E³.Connectivity Browser
Automatically visualise connection information as circuit diagram representations
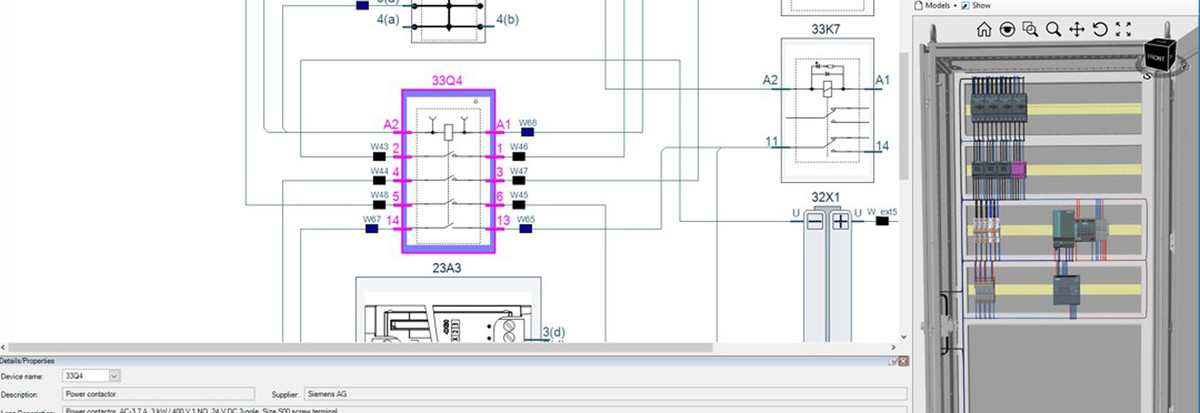
E³.ConnectivityBrowser is an innovative solution from Zuken which allows the visualization of circuits for specific use cases.
Using the connection data available in E³.series or connection information imported via a wire list, the required sections of a circuit can be prepared and displayed graphically in a fraction of a second.
DYNAMIC VISUALISATION
The digital connectivity model is used directly for the visualization.
This enables the representation to be generated in a way that meets the needs of individual users and use cases.
Complex relationships can be be visualized transparently and “on-the-fly”.
Additional component attributes, connectors, pins, or wires can be visualized in dedicated information windows.
ANALYSIS FUNCTIONALITY
In addition to the basic visualization, the E³.ConnectivityBrowser also offers various analysis functions such as cable harness, functional, or signal consistency analyses.
These help users to identify design errors during release processes.
Users can switch between a physical representation of a circuit diagram (e.g. with separation points, ground points, etc.) and a purely logical visualization at the network level.
CLOUD SOLUTION
A cloud-based application provides numerous opportunities, e.g. the distribution of circuit information within a service organization.
The web implementation of E³.ConnectivityBrowser supports these tasks in a perfect way.
The data from the authoring system can be made available online to the service technicians via a server in an intranet or via the Internet, and they can access it using a standard web browser.
FOCUS ON THE RELEVANT CONTEXT
Especially in a service scenario, it is important to display exactly the data that corresponds to the device or system that needs to be repaired.
In addition to this, the data should be reduced to the relevant circuit diagram context, so that service technicians receive the information they need, without having to work their way through a static set of documents.
The troubleshooting process can be additionally optimized by a direct link to diagnostic equipment
E³.CONNECTIVITY BROWSER INTERACTIVE EVALUATION
Spend just 10 minutes and experience this innovative solution yourself in our interactive web environment!
E³.ConnectivityBrowser is the only application able to read a pure digital connectivity data model and generate automatically high-quality schematic diagrams on the fly.
OTA YHEYTTÄ
Täytä yhteystietosi niin palaamme asiaan.